Parc Canberra EC Market Analysis
Oct 2018 to Jan 2020
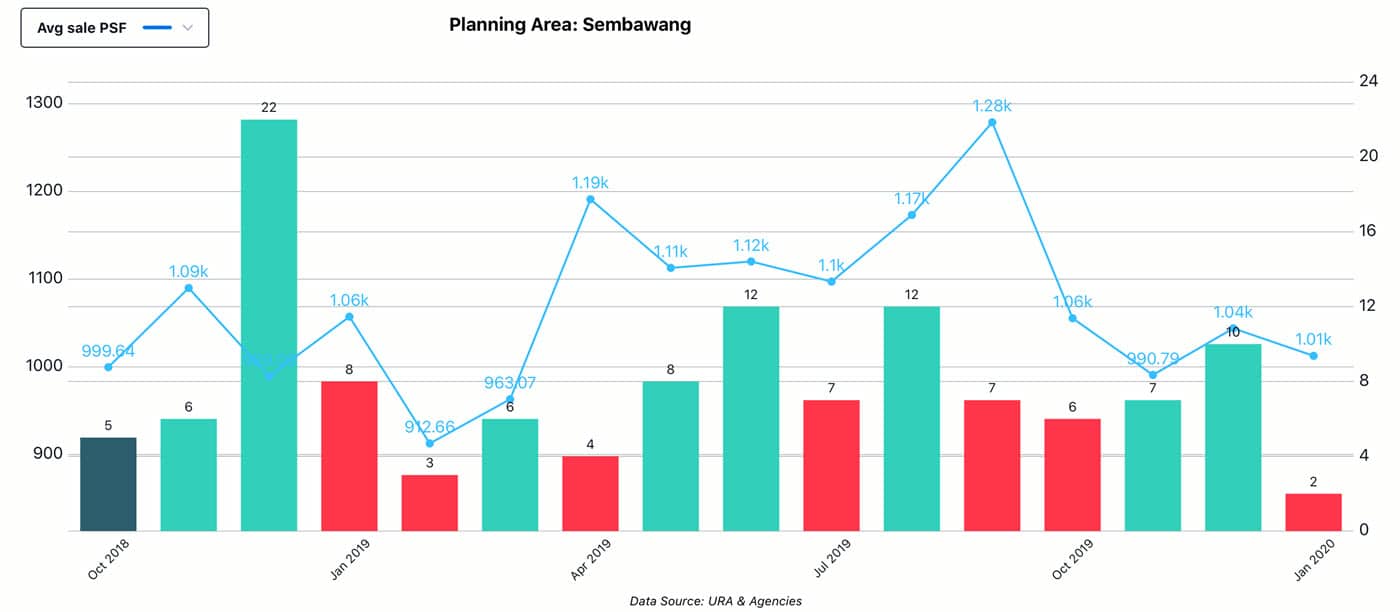
| Property Type | Private Condo / Apartments | ||
| By Planning Area | Sembawang |
||
| Transaction Type | Sale | ||
| Type of Sale | New Sale / Sub Sale / Resale | ||
| Tenure | Freehold / 99-103 / 104-999 | ||
| YYYY/MM | Transaction Volume | Average PSF ($) | Median Valuation ($) |
| 2018/10 | 5 | 999.64 | 830,000 |
| 2018/11 | 6 | 1,089.88 | 1,005,000 |
| 2018/12 | 22 | 989.06 | 1,085,000 |
| 2019/01 | 8 | 1,057.22 | 948,150 |
| 2019/02 | 3 | 912.66 | 848,000 |
| 2019/03 | 6 | 963.07 | 1,004,300 |
| 2019/04 | 4 | 1,191.10 | 1,111,200 |
| 2019/05 | 8 | 1,112.87 | 994,000 |
| 2019/06 | 12 | 1,120.16 | 1,237,350 |
| 2019/07 | 7 | 1,097.23 | 1,080,200 |
| 2019/08 | 12 | 1,173.23 | 982,800 |
| 2019/09 | 7 | 1,278.88 | 1,050,600 |
| 2019/10 | 6 | 1,055.45 | 923,000 |
| 2019/11 | 7 | 990.79 | 949,200 |
| 2019/12 | 10 | 1,043.95 | 1,199,050 |
| 2020/01 | 2 | 1,012.54 | 1,257,500 |
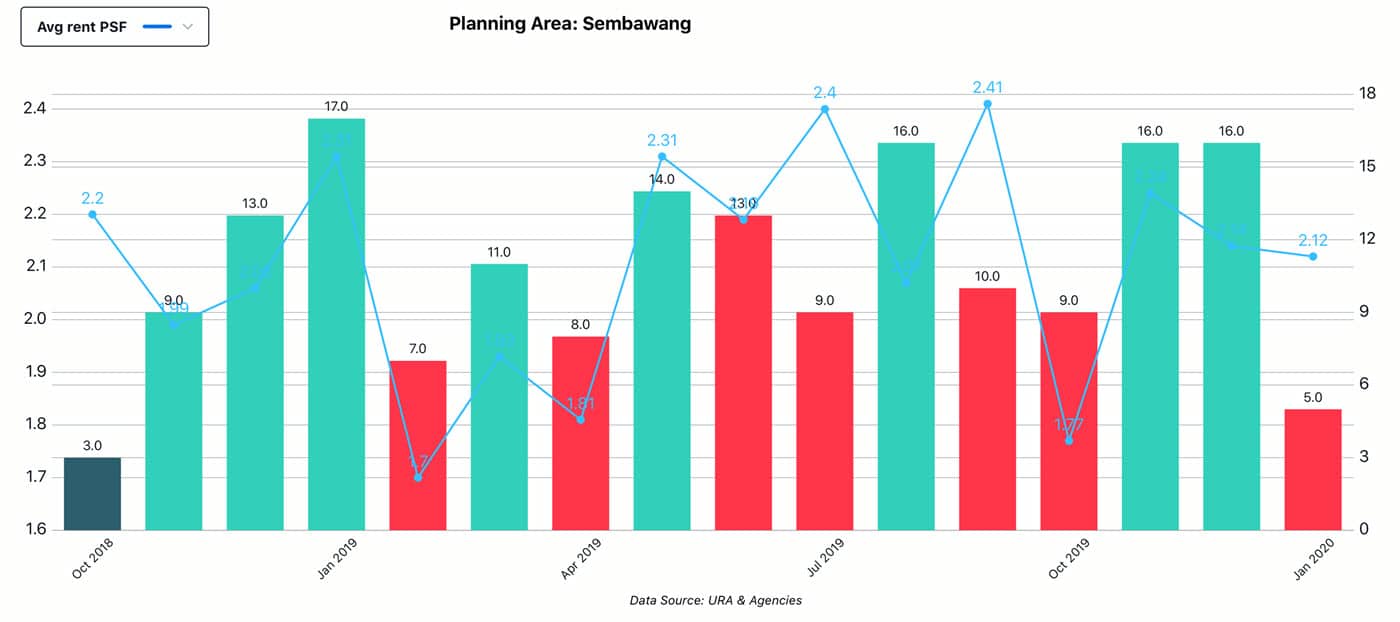
| Property Type | Private Condo / Apartments | ||
| By Planning Area | Sembawang | ||
| Transaction Type | Rent | ||
| Tenure | Freehold / 99-103 / 104-999 | ||
| YYYY/MM | Transaction Volume | Average PSF ($) | Average Rental Yield (%) |
| 2018/10 | 3 | 2.2 | 3.36 |
| 2018/11 | 9 | 1.99 | 3.12 |
| 2018/12 | 13 | 2.06 | 3.00 |
| 2019/01 | 17 | 2.31 | 3.39 |
| 2019/02 | 7 | 1.7 | 2.63 |
| 2019/03 | 11 | 1.93 | 2.87 |
| 2019/04 | 8 | 1.81 | 4.07 |
| 2019/05 | 14 | 2.31 | 3.73 |
| 2019/06 | 13 | 2.19 | 2.98 |
| 2019/07 | 9 | 2.40 | 3.25 |
| 2019/08 | 16 | 2.07 | 3.15 |
| 2019/09 | 10 | 2.41 | 3.53 |
| 2019/10 | 9 | 1.77 | 3.16 |
| 2019/11 | 16 | 2.24 | 3.17 |
| 2019/12 | 16 | 2.14 | 3.88 |
| 2020/01 | 5 | 2.12 | 3.37 |
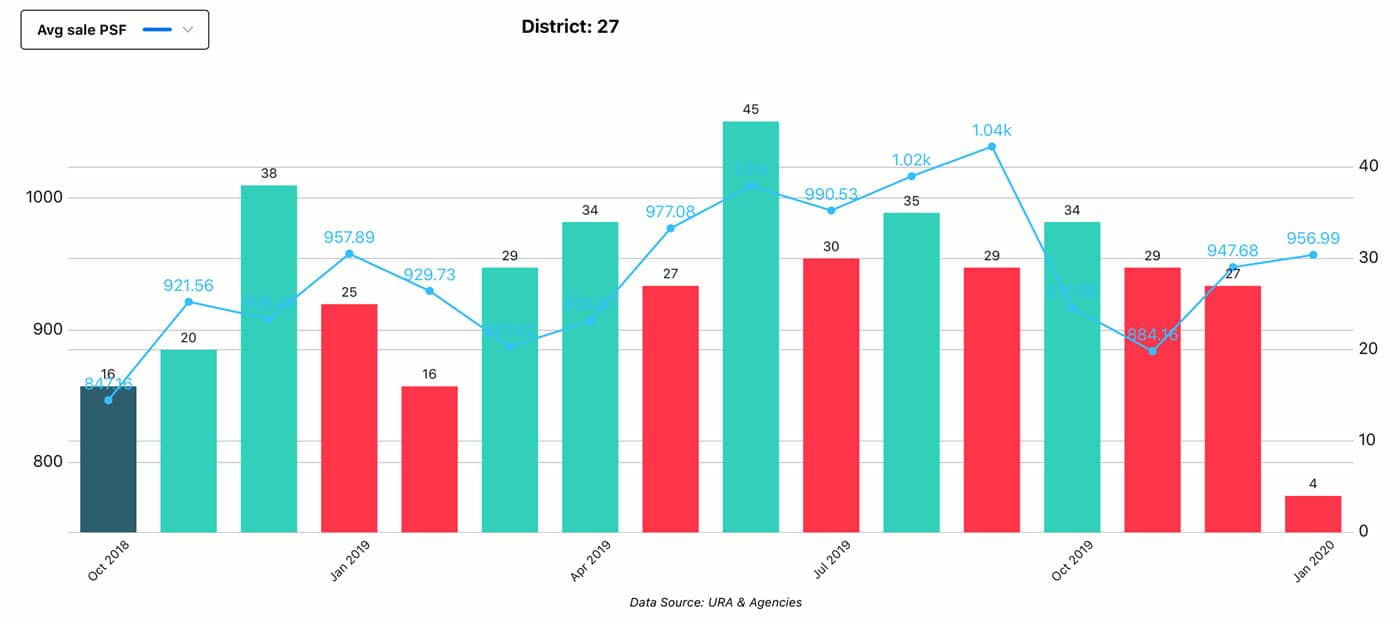
| Property Type | Private Condo / Apartments | ||
| By District | D27 (Sembawang / Yishun) | ||
| Transaction Type | Sale | ||
| Type of Sale | New Sale / Sub Sale / Resale | ||
| Tenure | Freehold / 99-103 / 104-999 | ||
| YYYY/MM | Transaction Volume | Average PSF ($) | Median Valuation ($) |
| 2018/10 | 16 | 847.16 | 850,000 |
| 2018/11 | 20 | 921.56 | 945,000 |
| 2018/12 | 38 | 908.46 | 959,000 |
| 2019/01 | 25 | 957.89 | 950,000 |
| 2019/02 | 16 | 929.73 | 843,000 |
| 2019/03 | 29 | 887.62 | 915,000 |
| 2019/04 | 34 | 906.97 | 957,500 |
| 2019/05 | 27 | 977.08 | 980,000 |
| 2019/06 | 45 | 1,009.09 | 1,100,000 |
| 2019/07 | 30 | 990.53 | 982,700 |
| 2019/08 | 35 | 1,016.44 | 980,000 |
| 2019/09 | 29 | 1,038.88 | 1,010,000 |
| 2019/10 | 34 | 916.96 | 927,500 |
| 2019/11 | 29 | 884.16 | 943,000 |
| 2019/12 | 27 | 947.68 | 963,000 |
| 2020/01 | 4 | 956.99 | 1,007,500 |
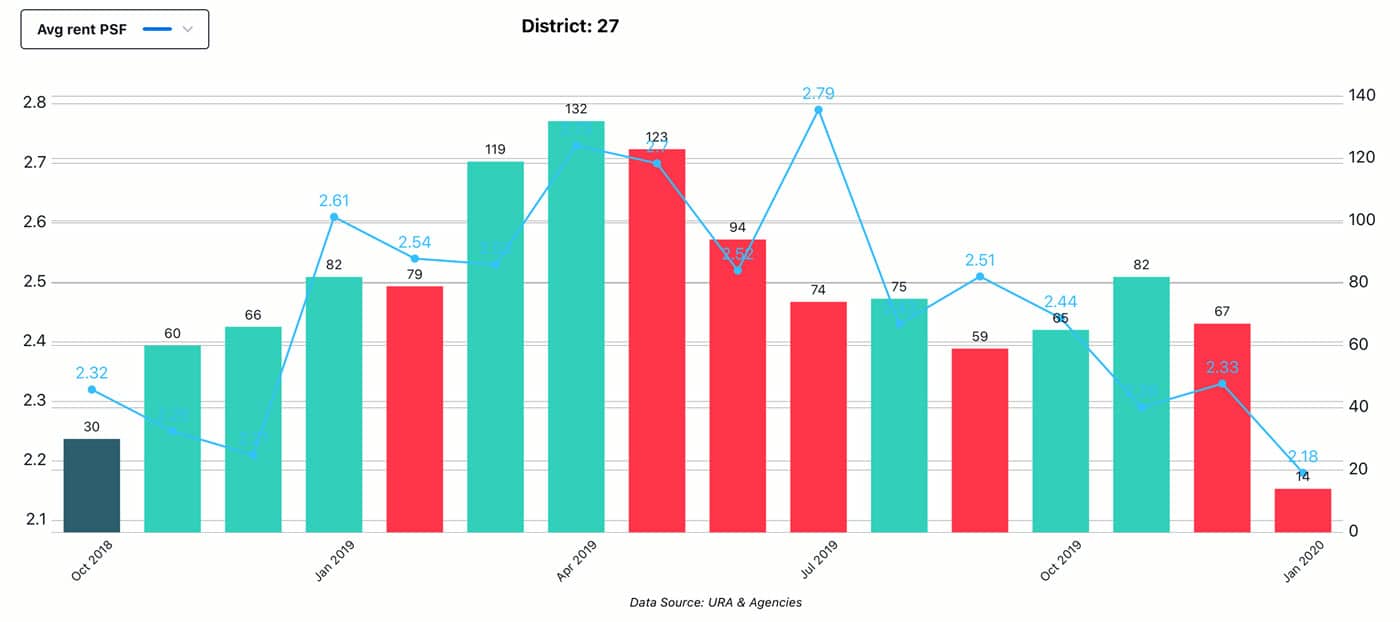
| Property Type | Private Condo / Apartments | ||
| By District | D27 (Sembawang / Yishun) | ||
| Transaction Type | Rent | ||
| Tenure | Freehold / 99-103 / 104-999 | ||
| YYYY/MM | Transaction Volume | Average PSF ($) | Average Rental Yield (%) |
| 2018/10 | 30 | 2.32 | 3.37 |
| 2018/11 | 60 | 2.25 | 3.25 |
| 2018/12 | 66 | 2.21 | 3.34 |
| 2019/01 | 82 | 2.61 | 3.39 |
| 2019/02 | 79 | 2.54 | 3.07 |
| 2019/03 | 119 | 2.53 | 3.01 |
| 2019/04 | 132 | 2.73 | 3.10 |
| 2019/05 | 123 | 2.70 | 3.20 |
| 2019/06 | 94 | 2.52 | 3.05 |
| 2019/07 | 74 | 2.79 | 3.21 |
| 2019/08 | 75 | 2.43 | 3.11 |
| 2019/09 | 59 | 2.51 | 3.26 |
| 2019/10 | 65 | 2.44 | 3.27 |
| 2019/11 | 82 | 2.29 | 3.39 |
| 2019/12 | 67 | 2.33 | 3.41 |
| 2020/01 | 14 | 2.18 | 3.84 |
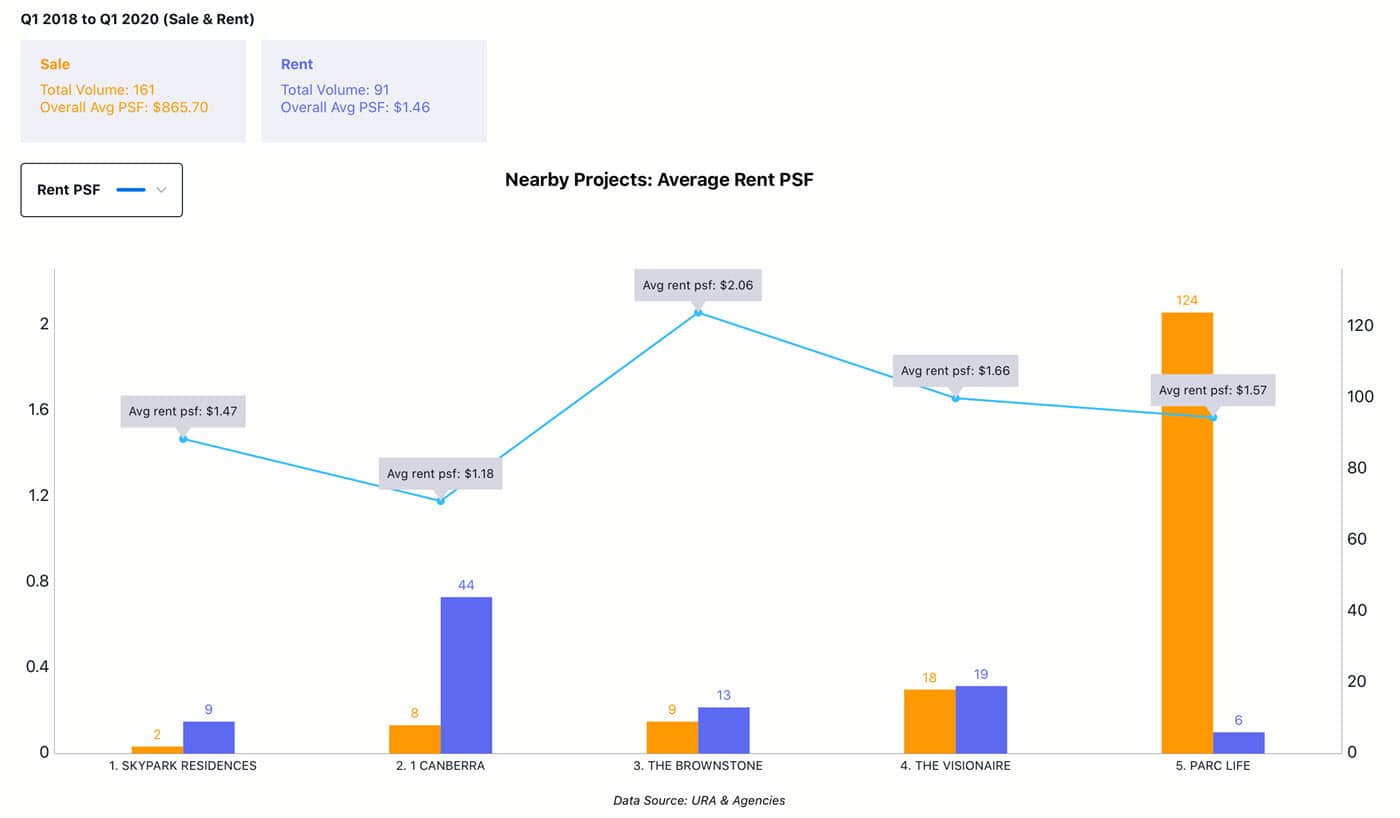
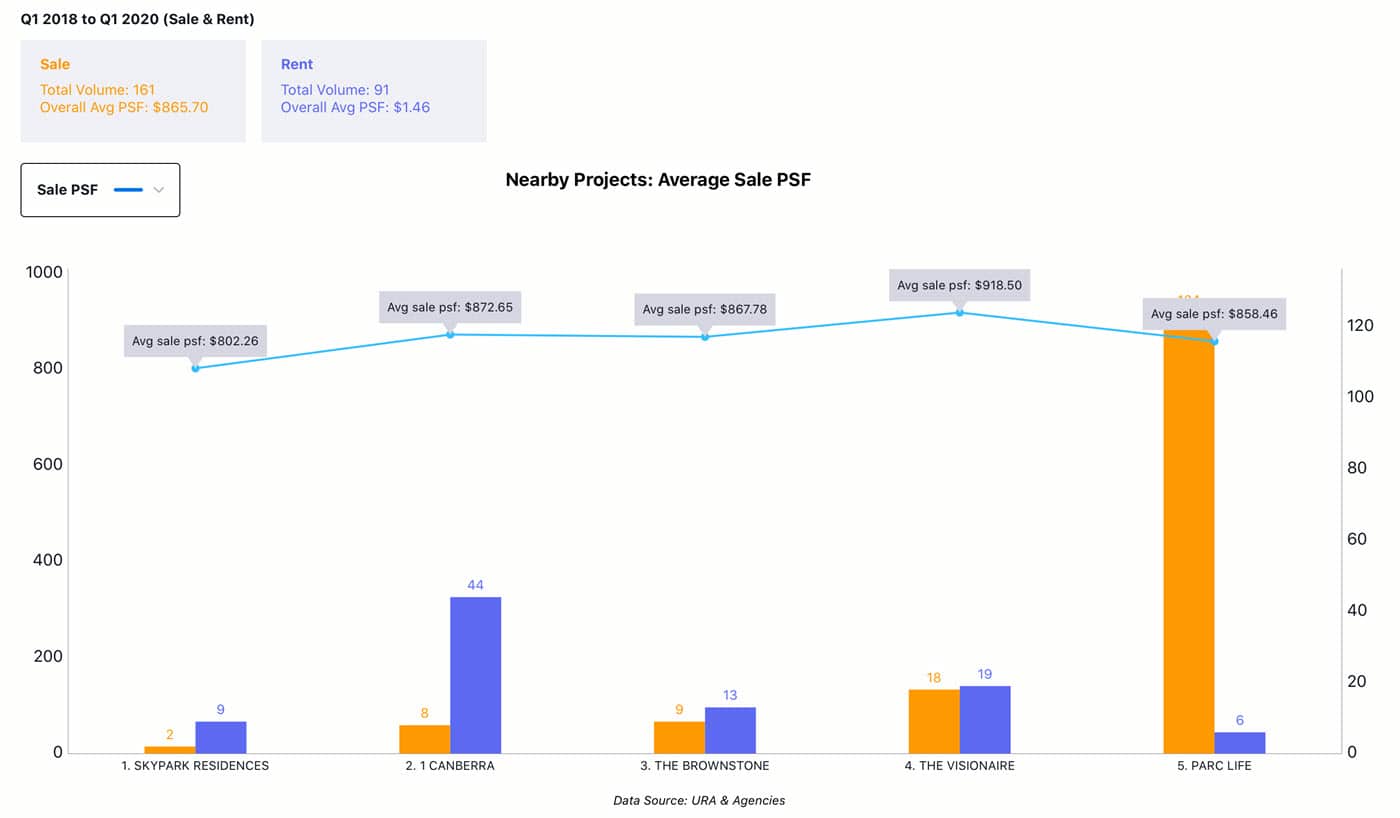
Parc Canberra EC Nearby Projects Analysis
Q12018 to Q12020
| Project Name | Type | Tenure | Avg. Sale PSF ($) | Sale Transaction Volume |
| 1 Canberra | EC | 99 Yrs fr 2012 | 872.65 | 8 |
| SkyPark Residences | EC | 99 Yrs fr 2013 | 802.26 | 2 |
| The Brownstone | EC | 99 Yrs fr 2014 | 867.78 | 9 |
| The Visionaire | EC | 99 Yrs fr 2014 | 918.50 | 18 |
| Parc Life | EC | 99 Yrs fr 2014 | 858.46 | 124 |
| Project Name | Type | Tenure | Avg. Rent PSF ($) | Rent Transaction Volume |
| 1 Canberra | EC | 99 Yrs fr 2012 | 1.18 | 44 |
| SkyPark Residences | EC | 99 Yrs fr 2013 | 1.47 | 9 |
| The Brownstone | EC | 99 Yrs fr 2014 | 2.06 | 13 |
| The Visionaire | EC | 99 Yrs fr 2014 | 1.66 | 19 |
| Parc Life | EC | 99 Yrs fr 2014 | 1.57 | 6 |